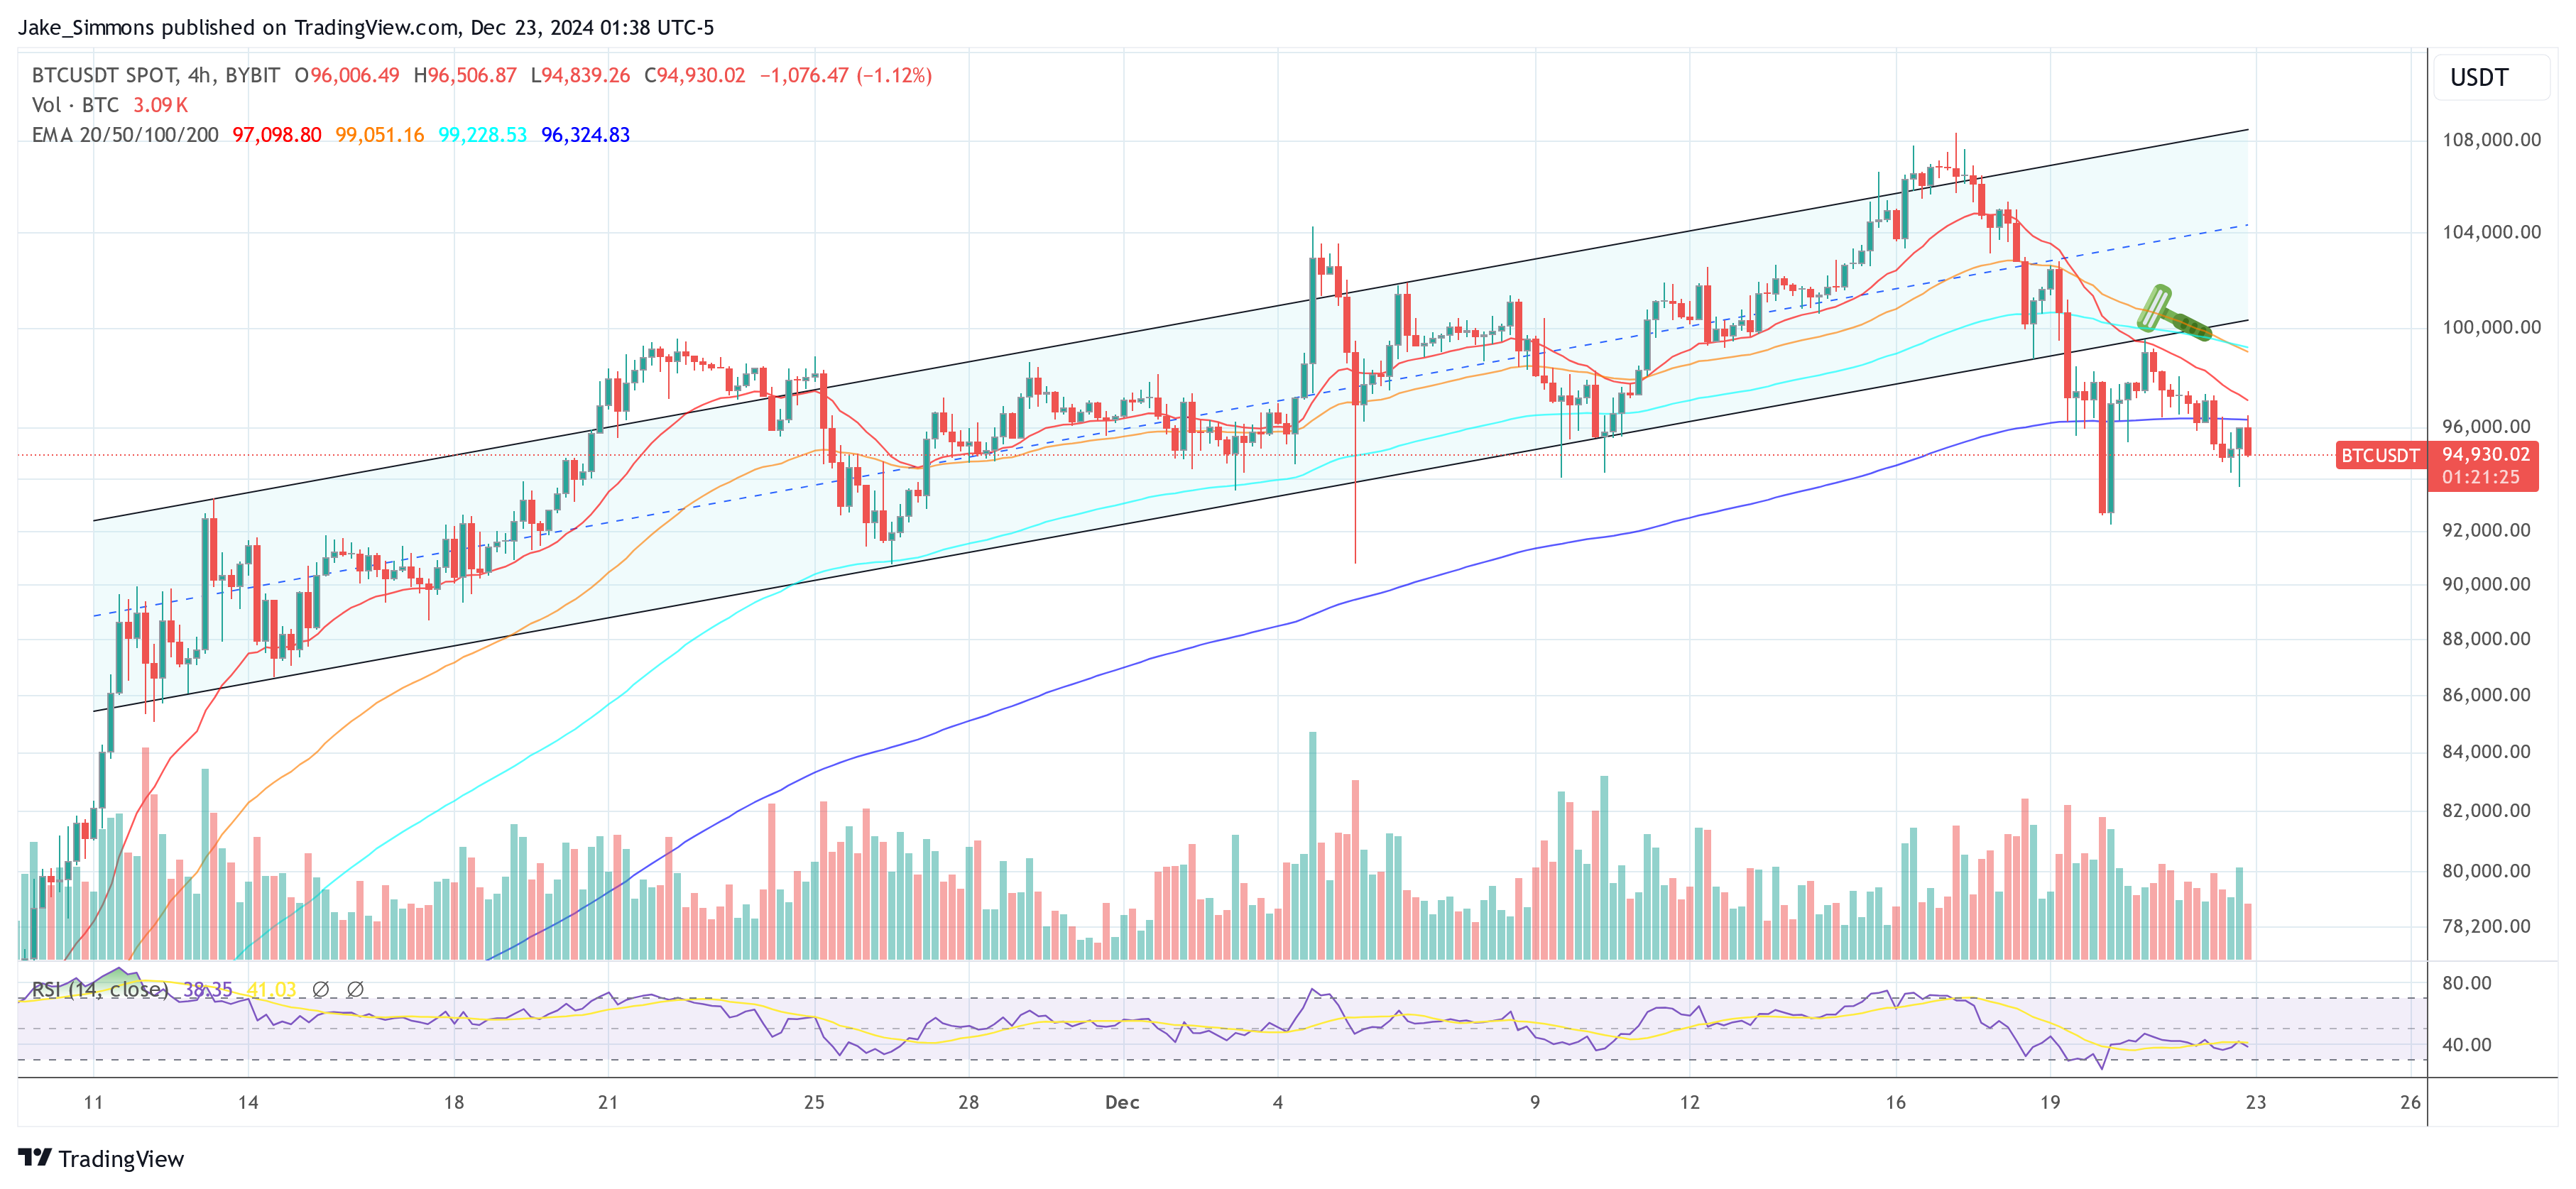
In his latest video published on December 21, crypto analyst Rekt Capital tried to answer the question “What’s The Worst Case Scenario For Bitcoin Right Now?”. After reaching a new all-time high at $108,374 on December 17, the BTC price is down more than -11%.
How Low Can Bitcoin Price Go?
Rekt Capital put the Bitcoin price pullback in a historical perspective, underscoring the historical importance of weeks 6, 7, and 8 in a “price discovery uptrend.” Drawing upon past cycles such as 2013, 2016–2017, and 2021, he explained that Bitcoin has a strong tendency to correct during these specific windows, with some dips reaching as steep as 34% or even higher.
“Understanding these weeks is crucial because they tend to be problematic for Bitcoin,” Rekt Capital stated, referencing past cycles where significant downturns occurred within this timeframe. For instance, in week 7 of the 2013 cycle, Bitcoin experienced a dramatic 75% pullback over 13 weeks. Similarly, the 2016-2017 period saw a 34% decline in week 8, underscoring the recurring vulnerability during these specific weeks.
Related Reading
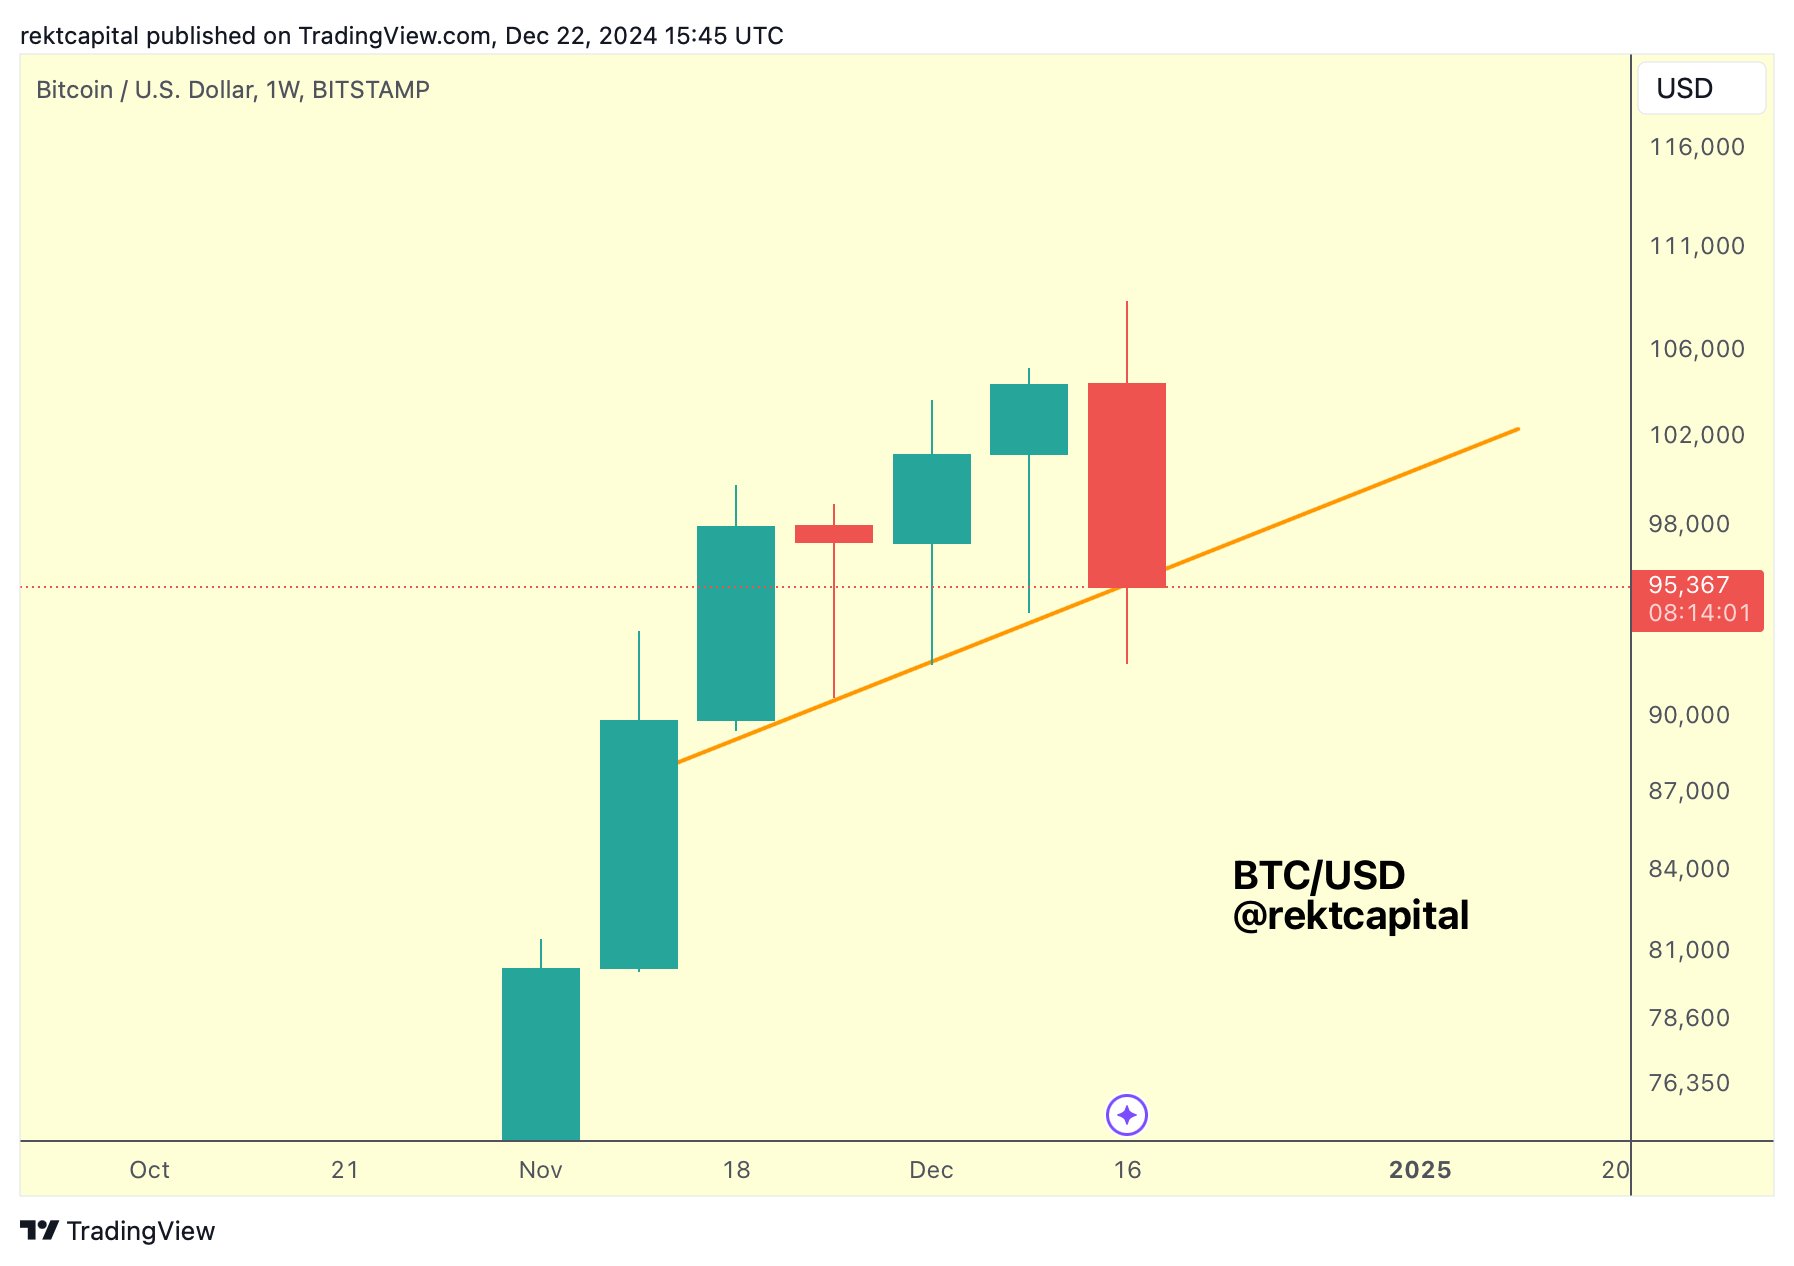
As of the current cycle, Bitcoin has undergone a 10%+ retracement, bringing its price into a historically critical support zone at $96,537 on the weekly chart. Rekt Capital emphasized the importance of this support level, noting, “This area of historical support has enabled the move to $108,000.” He cautioned that failure to maintain this support could trigger a more severe correction down to $89,830.
Examining the price action of the last few days, Rekt Capital pointed out the emergence of a bearish engulfing candle in the weekly timeframe—a technical indicator often associated with potential reversals. “We’re losing resistances that turned into support,” he observed. This loss signifies a potential transition into a corrective period, as the price struggles to maintain its upward trajectory.
Related Reading
Rekt Capital also pointed out the importance of maintaining the 5-week technical line in his analysis. “If we lose this 5-week technical uptrend and the orange trend line, it would be mounting evidence that we might be transitioning into a corrective period,” he warned.

Furthermore, he addressed the CME gap between the $78,000 and $80,000 price levels, a critical area that has remained unfilled. “Delving into 26%, 27%, 28% dips could fill the entire CME gap,” Rekt Capital noted.
Historically, CME gaps have the tendency to get filled whereas there are a few ones which have never been filled.
Despite all cautionary signals, Rekt Capital maintains a bullish stance in the long-term “These pullbacks are what enable future uptrends in the parabolic phase of the cycle,” he explained. Drawing from previous cycles, he illustrated how corrections have historically provided the necessary “breather” for the market.
In the 2021 cycle, for example, Bitcoin experienced a 16% pullback in week 6 and an 8% dip in week 8, yet the overall trend continued upward. Similarly, the current 10% retracement, while significant, could serve as a preparatory phase for the next leg of price discovery.
At press time, BTC traded at $95,000.

Featured image created with DALL.E, chart from TradingView.com
This news is republished from another source. You can check the original article here


