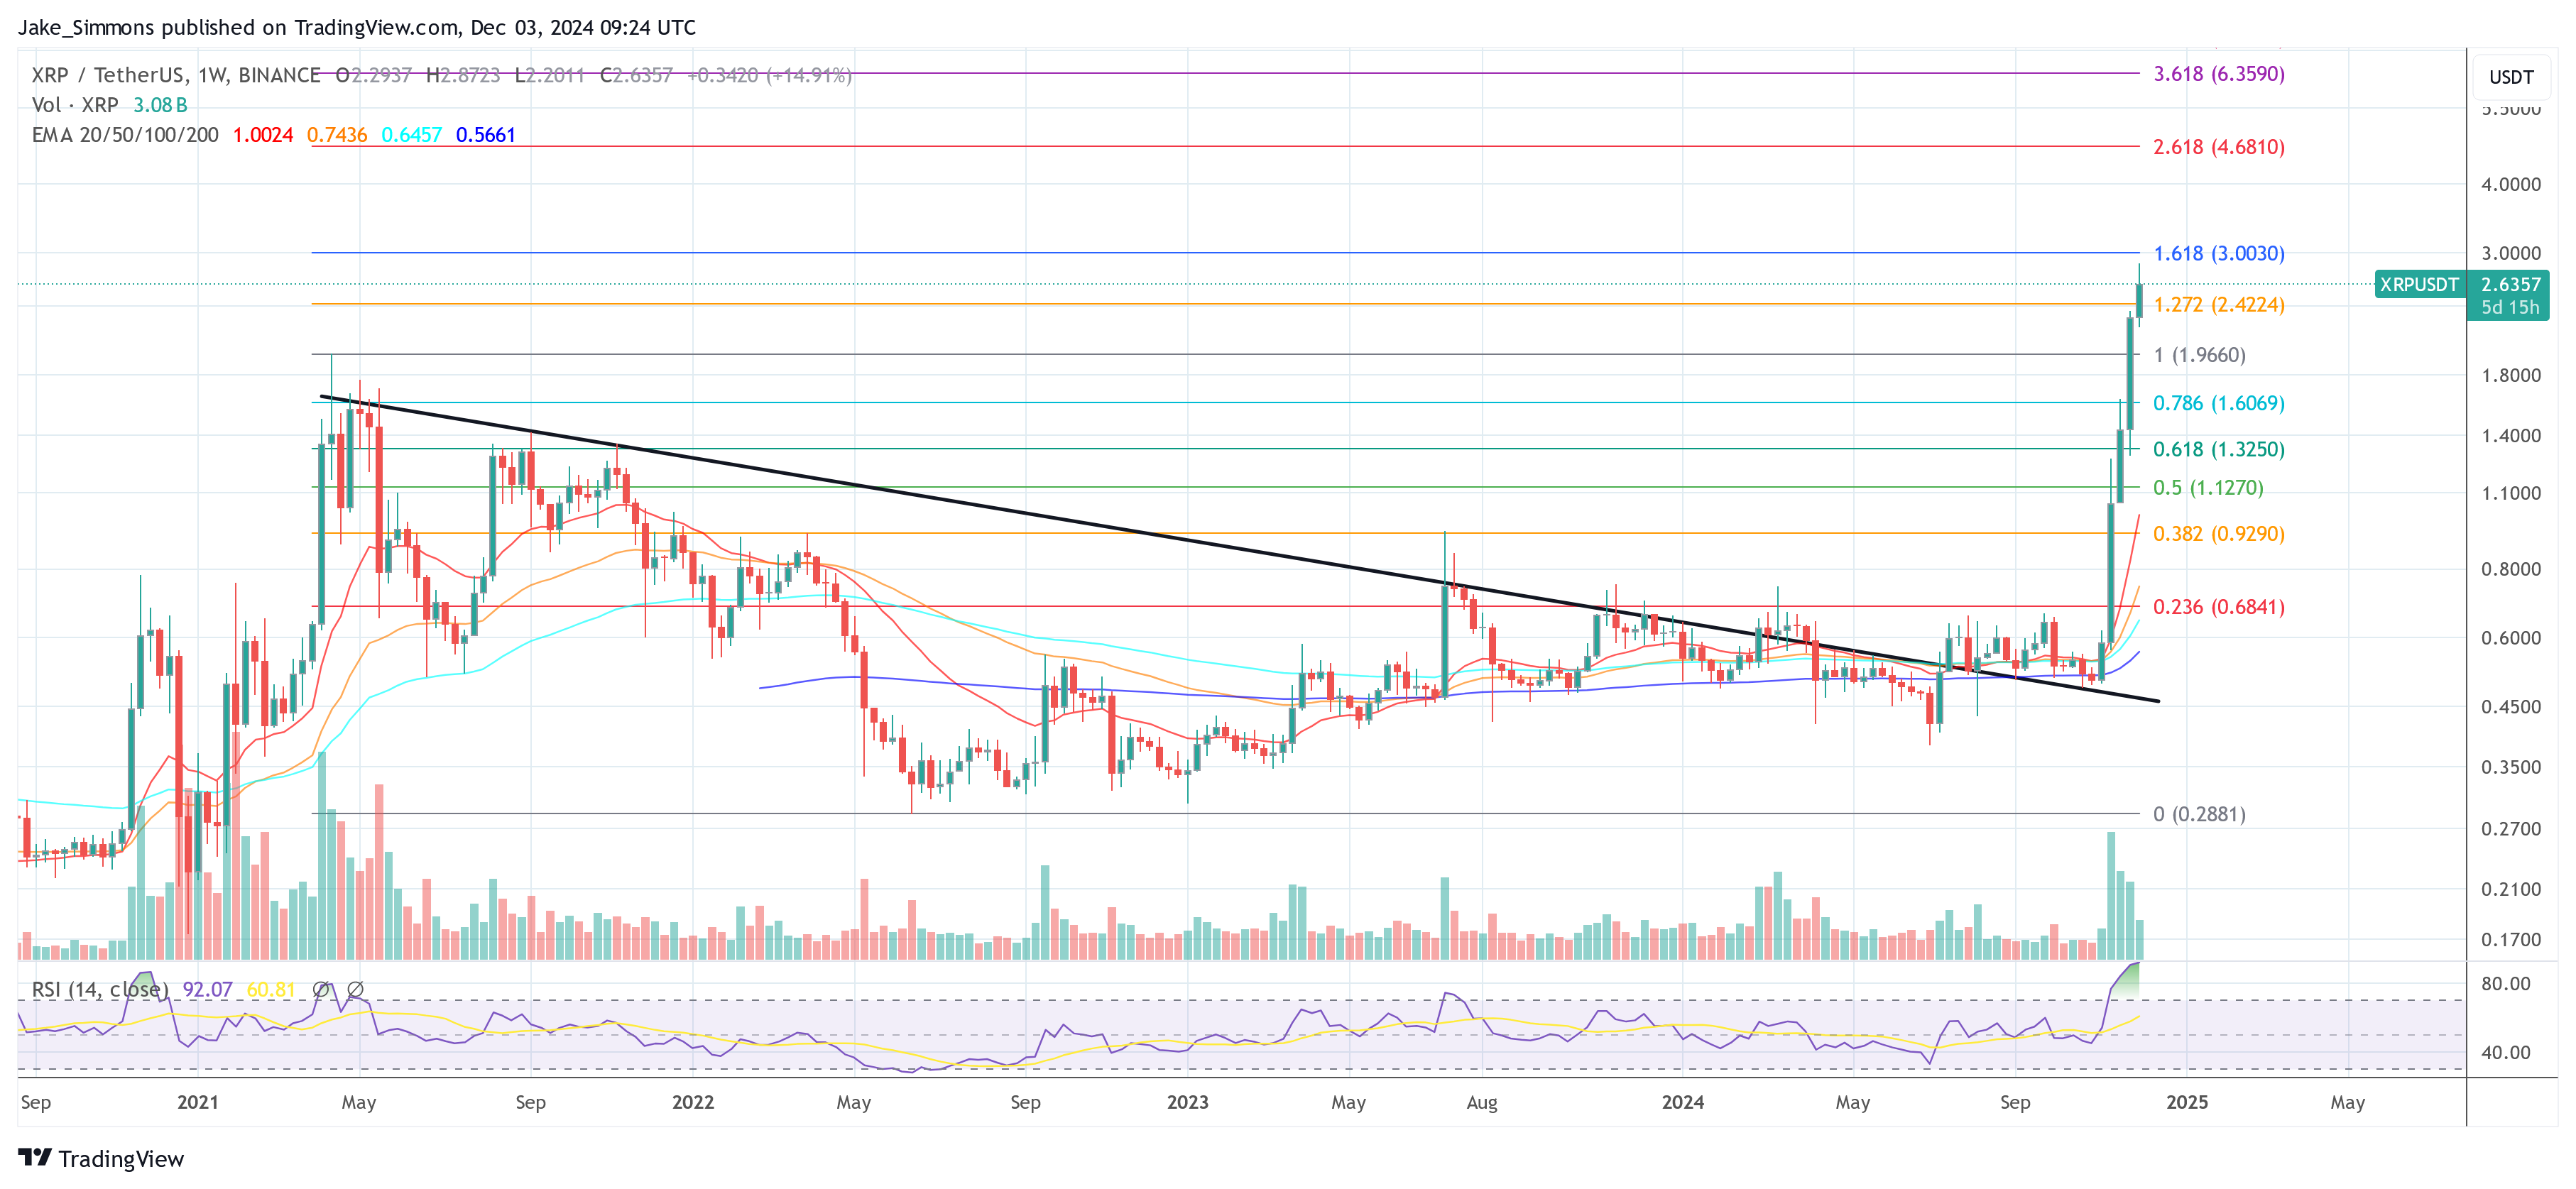
XRP has experienced an extraordinary surge in recent weeks, with its price skyrocketing by 380% over the past 23 days. In just the last four days, the price jumped 75%, reaching a peak of $2.87 on December 2. This rapid ascent appears to be fueled by significant buying activity from large investors, commonly known as “whales.”
Ki Young Ju, CEO of on-chain analysis firm CryptoQuant, highlighted that these whales are primarily operating through the US based exchange Coinbase. On December 2, he pointed out that “Coinbase whales are driving this XRP rally,” noting that Coinbase’s minute-level price premium ranged from 3% to 13% during the surge.
In contrast, Upbit—a Korean exchange with more XRP investors than Binance—showed no significant premium, suggesting the buying pressure is predominantly originating from the United States.
On his alternative X account (@kate_young_ju), Ki Young Ju hinted at possible insider activity influencing the market dynamics, stating, “Someone knew something.”
Related Reading
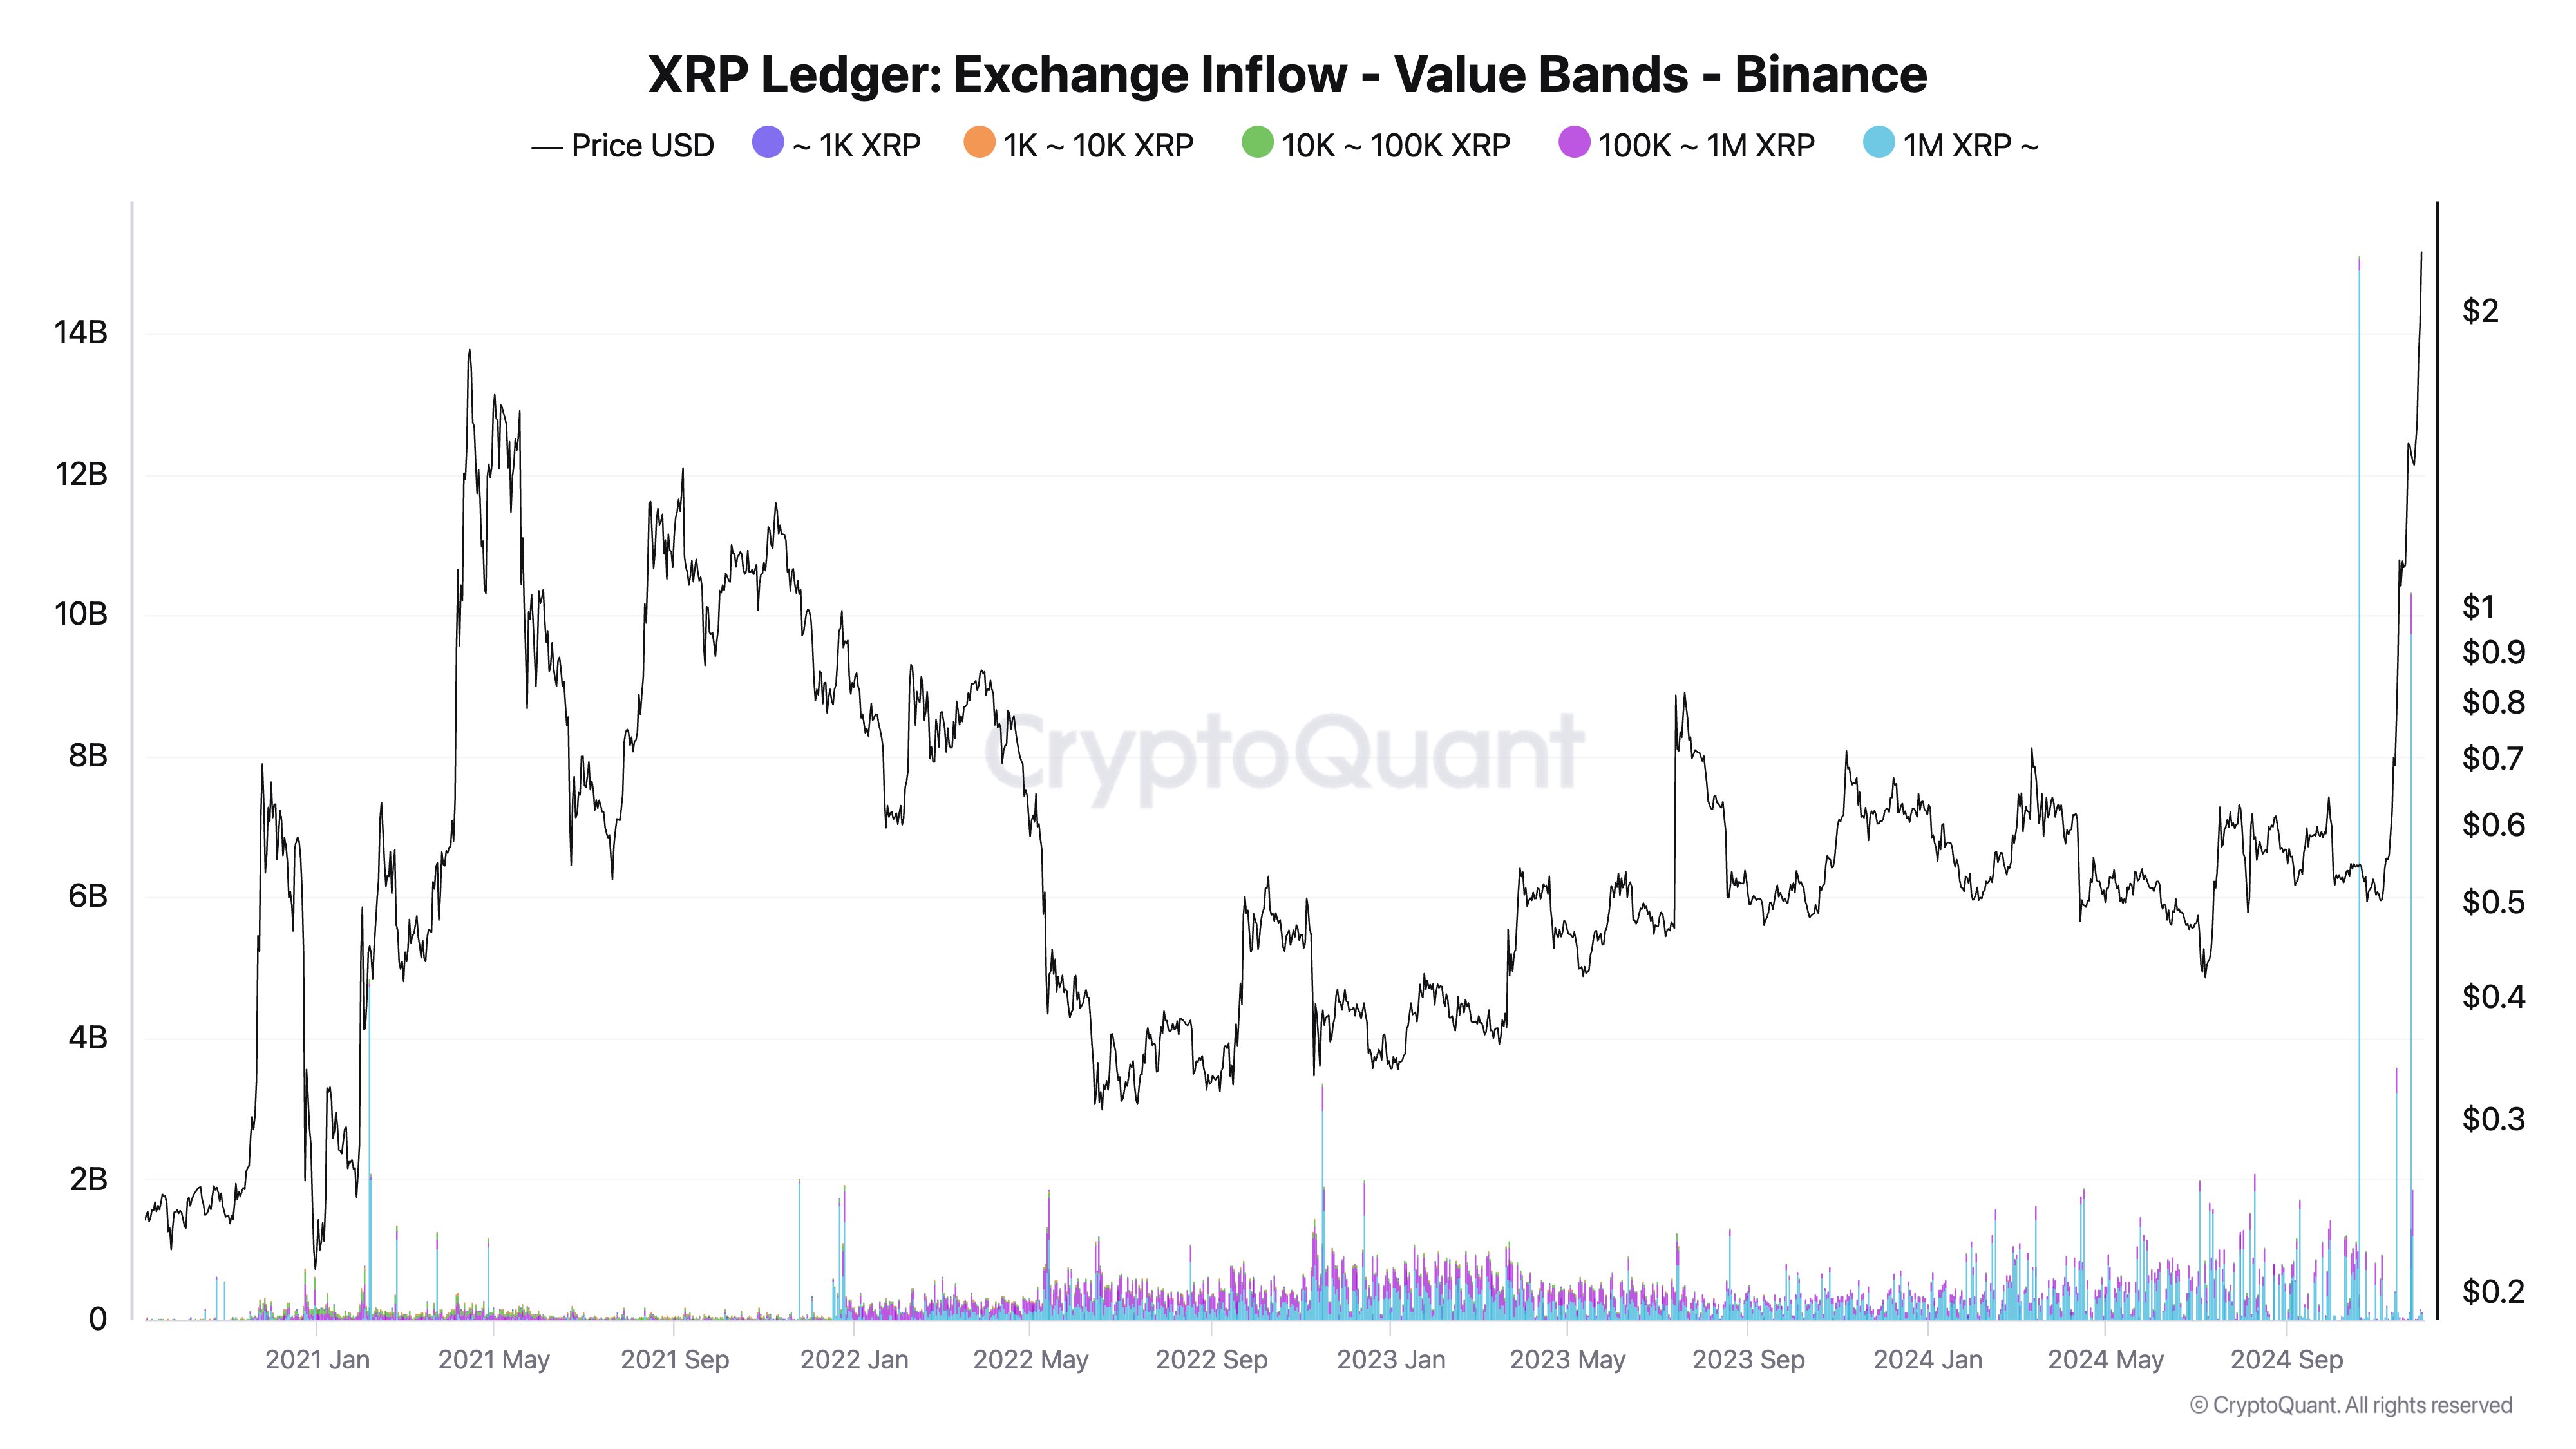
Today, he cautioned traders against shorting XRP. “Shorting XRP right now seems risky, imo. $25B XRP deposit before the pump might look like market manipulation but could simply be front-running. This insider whale might know something extremely bullish about XRP, such as spot ETF approval,” he speculated.

He further shared a chart “XRP: Retail Activity Through Trading Frequency Surge (Spot & Futures), which indicates that retail trading activity for XRP has surpassed the highs of 2021 and is nearing levels last seen in January 2018, when XRP reached its all-time high of $3.92.
Related Reading
Observing the one-year cumulative volume delta (CVD) of taker buy/sell volume, he remarked: “1-year CVD of Taker Buy/Sell Volume for XRP shows a historic rebound. Whales are aggressively using market orders, driving overwhelming demand.”
A 700% Rallye Incoming For XRP Against BTC?
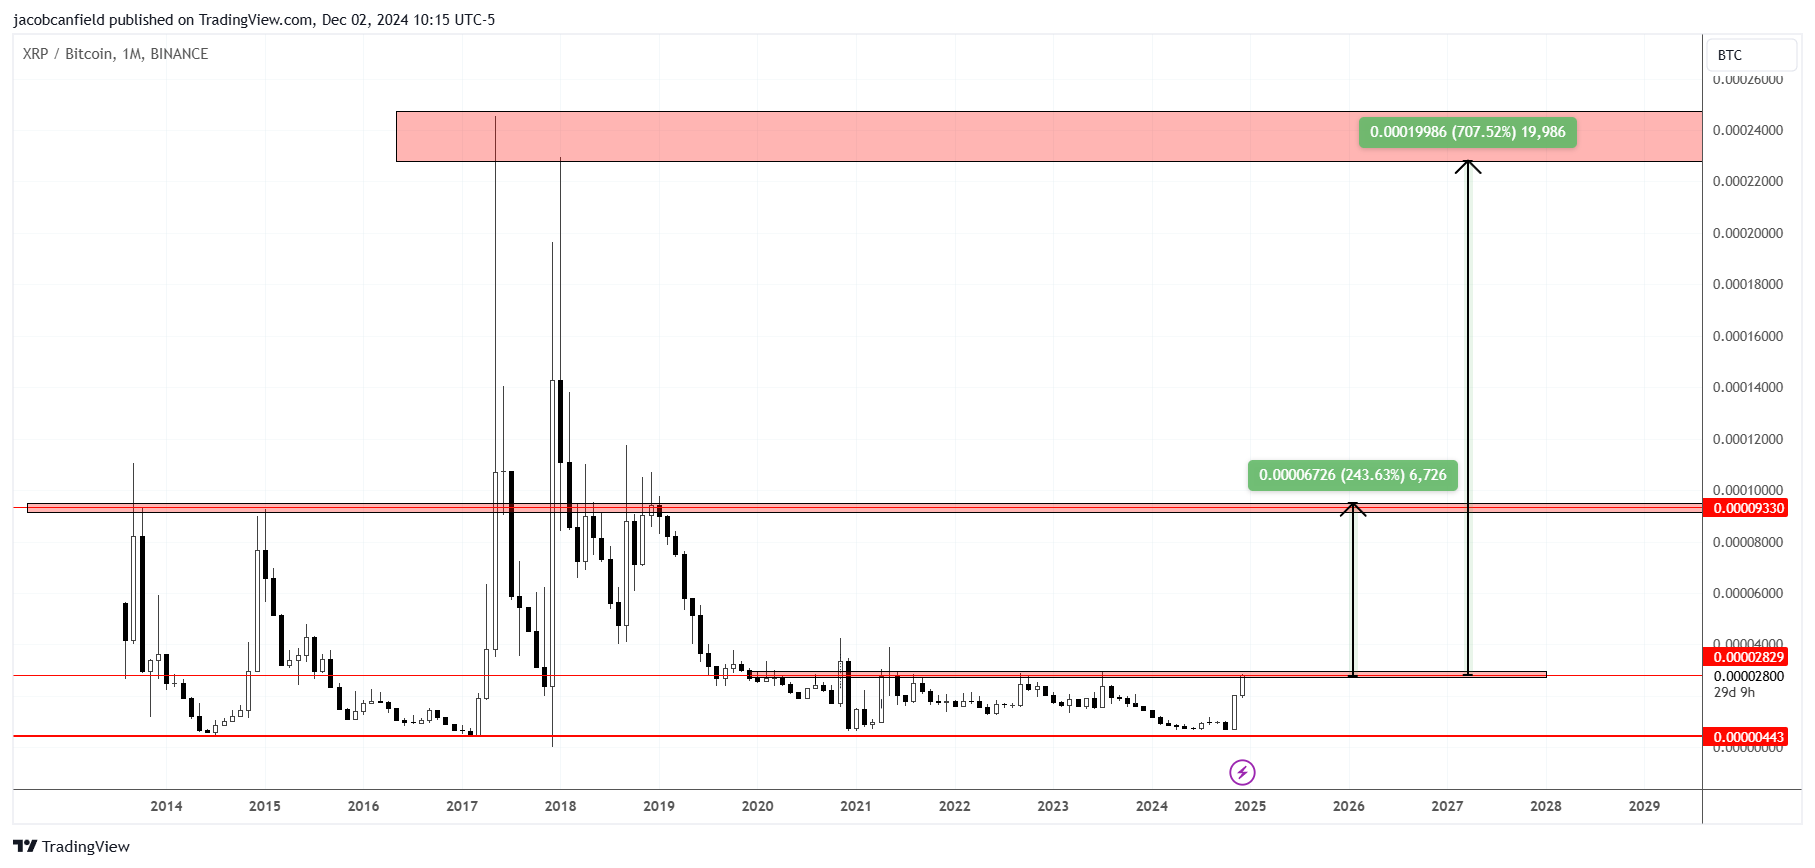
From a technical analysis perspective, crypto analyst Jacob Canfield emphasizes the importance of examining the XRP/BTC pairing. He notes that XRP is currently at a critical resistance zone on the BTC pair chart (XRPBTC), having just reached the $2.75 level on the USDT pair—a resistance point since December 2019.
Canfield suggests that a breakout here could signal a potential 240% move back to key resistance zones from 2017, 2018, and 2019. “If we get real FOMO, then we could be setting up for another 700% move to all-time high against Bitcoin,” he commented, acknowledging the “two of the strongest monthly candles for XRP that we’ve seen in over 5 years.”

Looking at shorter time-frames of the XRP/USD pair, Canfield highlights the utility of support and resistance levels to identify new entry points in these time frames. “In bull markets, you need to use low time frame support/resistance to find new entries. 5 min/15 min are the best. XRP as an example – $2.20 was the clear S/R invalidation. Base of the biggest green candle = base of impulse. Usually the best place to re-enter a trade.”
At press time, XRP traded at $2.63.

Featured image created with DALL.E, chart from TradingView.com
This news is republished from another source. You can check the original article here


