Markets don’t seem to think so…
Cryptocurrencies have long puzzled traditional stock analysts. How can an asset class with no earnings, dividends, or fundamental value be worth anything more than zero?
Yet here we are. Bitcoin (BTC-USD) is worth almost $1 trillion. $75 million worth of non-fungible tokens (NFTs) trade hands daily. Even “meme” coins are returning. Speculators are naturally drawn to rising prices, and their buying pressure often sends prices even higher, regardless of the fundamentals.
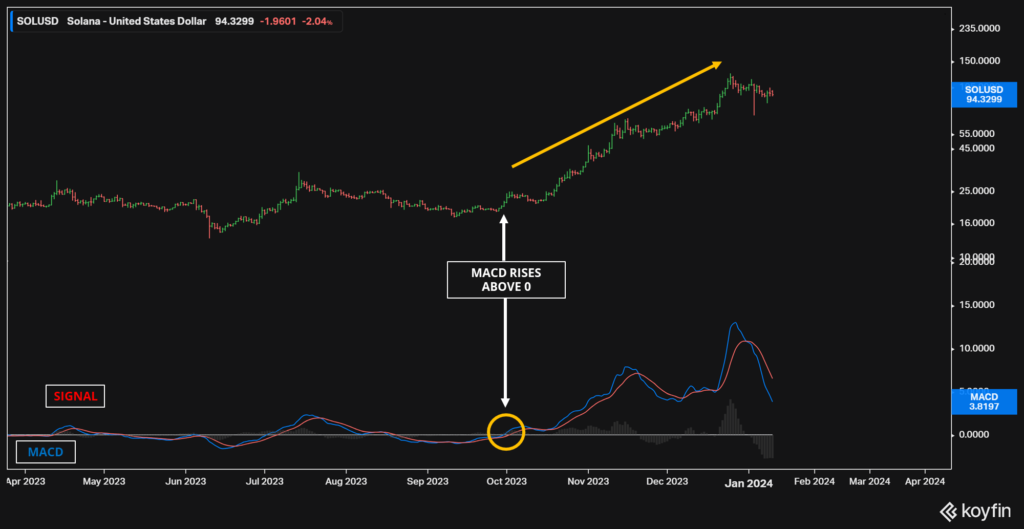
Today, a new cryptocurrency has captured speculator interest. Since October, prices of Solana (SOL-USD) have risen from the $20 range to nearly $100, making it one of the best-performing large-cap cryptos on the market. The FTX scandal that plagued Solana is fading from the market’s collective memory, and the high-quality cryptocurrency continues to hold an impressive technological lead over rivals.
Could Solana, therefore, become the next Bitcoin?
Solana Prices: Using Technical Analysis
To answer this, I turn to technical analysis — the use of pricing and other data to determine investor sentiment.
We know from history that technical analysis can work in certain circumstances. Many high-risk moonshot companies (similarly with no earnings, dividends, or fundamental worth) follow predictable patterns that technical analysis strategies can exploit. And machine learning can also be used to sniff out patterns with startling efficiency. (In that particular study, I show how neural networks can pick out Bitcoin trades that return 25% on average!)
Fortunately, you don’t need a degree in data science to find patterns that work. You only need to know the tools and assets you’re working with.
Consider Bitcoin, a coin that typically “breaks out” when investor interest is high, and then flatlines when it fades from headlines. Here, I’ll use a MACD Crossover Strategy — a technical strategy particularly good at finding “breakouts” while ignoring sideways movements.
As you might expect, the MACD strategy does exceptionally well on Bitcoin. Since 2013, the system has returned four times more than a buy-and-hold strategy, even without short positions. (The flat orange lines represent times where the strategy sells its Bitcoin and holds cash).
The same is true for Solana. Though the MACD system failed to capture all of Solana’s upside during the 2021 crypto craze, it was enough to outperform the buy-and-hold strategy over the long run. The MACD system would have sold Solana in December 2021 (represented by the flatlining orange line) and kept investors mostly on the sidelines to come out far ahead.
What Does Technical Analysis Say About Solana Today?
Since October, the MACD indicator has been decidedly bullish on Solana. The MACD line (blue) remains above zero, and the gap between the MACD line (blue) and signal line (red) remains greater than the 0.015 threshold. This gap is important to avoid sideways trading.
That tells us that markets remain bullish about Solana’s prospects. The cryptocurrency has only traded above its current level 31% of the time, once you adjust for prices. And history tells us that the MACD line is a strong predictor of future gains.
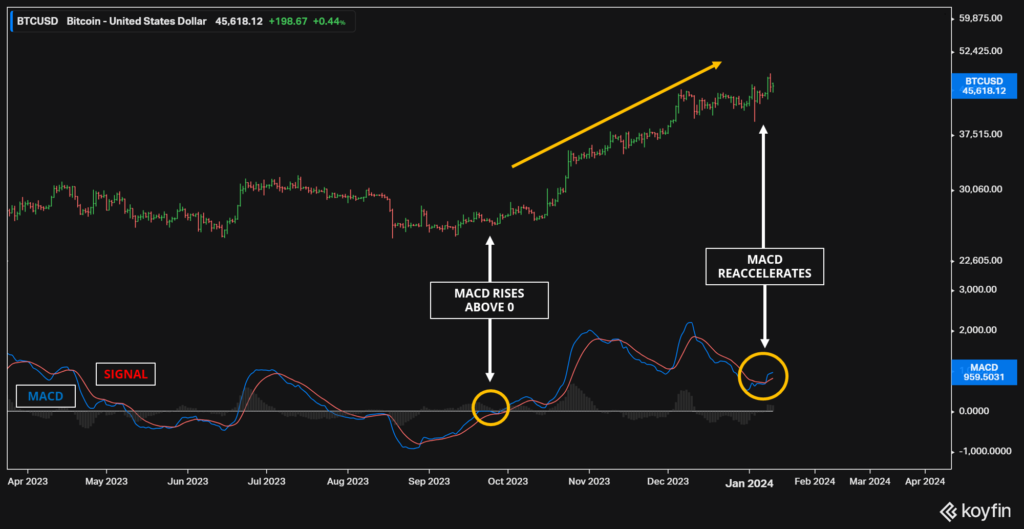
However, astute readers will notice that the MACD “strength” has dropped off since peaking in December. Prices have begun to cool off in recent weeks. And using the same graph for Bitcoin shows that the world’s largest cryptocurrency has rebounded more strongly than its smaller rival.
Together, that tells us that markets believe Solana is still not Bitcoin. Bitcoin remains far ahead, both in consumer adoption and potential regulation, and its rising prices reflect that sentiment. If you had to buy just one crypto, it should probably be Bitcoin.
What’s Next for Solana?
History tells us that Solana remains a “buy” at current prices. The cryptocurrency’s strong fourth quarter means its MACD signal remains above zero. And investor interest remains high; traded volumes in the past week remain 7 times higher than the average in 2023.
Solana saw a similar pattern emerge in September 2021, when the cryptocurrency’s MACD line dropped from 30 to 1.9 before accelerating back to 22. (Its price would rise from $164 to $220 during that reaccelerating period).
But even in 2021, Solana’s second surge was far smaller than its first. When asset prices are high, it takes far more fresh money to send values even higher.
This time around looks no different. Prices of Solana have already risen 5X since October, and Solana’s sagging MACD figure comes even as excitement over Bitcoin ETFs is rising.
In 2021, I recommended investors buy $500 of Dogecoin (DOGE-USD) to experience the meme mania firsthand. Prices of Dogecoin would eventually rise fivefold on extreme investor interest. This time around, however, I’m urging far more caution. Though the technicals suggest that Solana will grind higher, investors should still remember that it pays to wait for the best opportunities.
On the date of publication, Thomas Yeung did not have (either directly or indirectly) any positions in the securities mentioned in this article. The opinions expressed in this article are those of the writer, subject to the InvestorPlace.com Publishing Guidelines.
This news is republished from another source. You can check the original article here


